Analytics
We analyze your user's interactions with the quiz and present them with metrics and charts in the Analytics section.

Selectors
Choose the period of time to analyze with the selectors at the top of the page. Use the device selector if you want to see how usage differs between mobile and desktop. All metrics, charts and tables on the Analytics page are filtered according to the time and device selections.

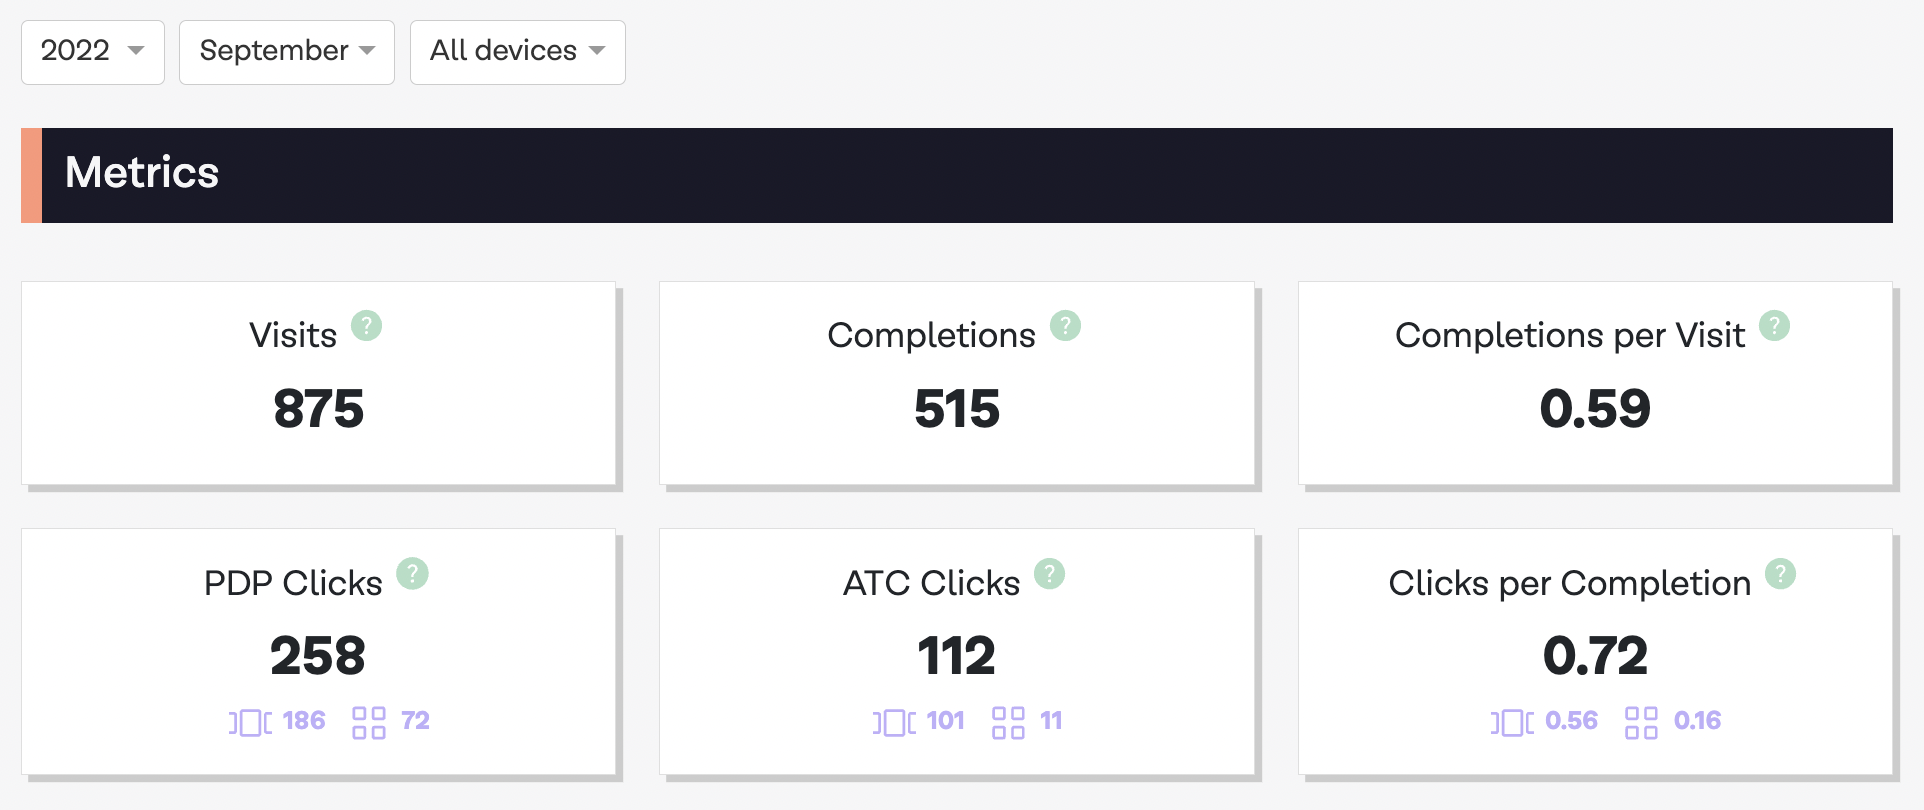
Interactions
We capture the following metrics:
- Visits: Total number of customer visits to the Product Finder
- Completions: Number of visits with at least one completed run through the quiz 1
- Completions per Visit: Fraction of visitors that completed the quiz
- PDP Clicks: Product detail pages visited directly from Featured products or Recommenations 2
- ATC Clicks: Products added to the shopping cart directly from Featured products or Recommenations 2
- Clicks per Completion: Sum of PDP and ATC clicks divided by completions 2
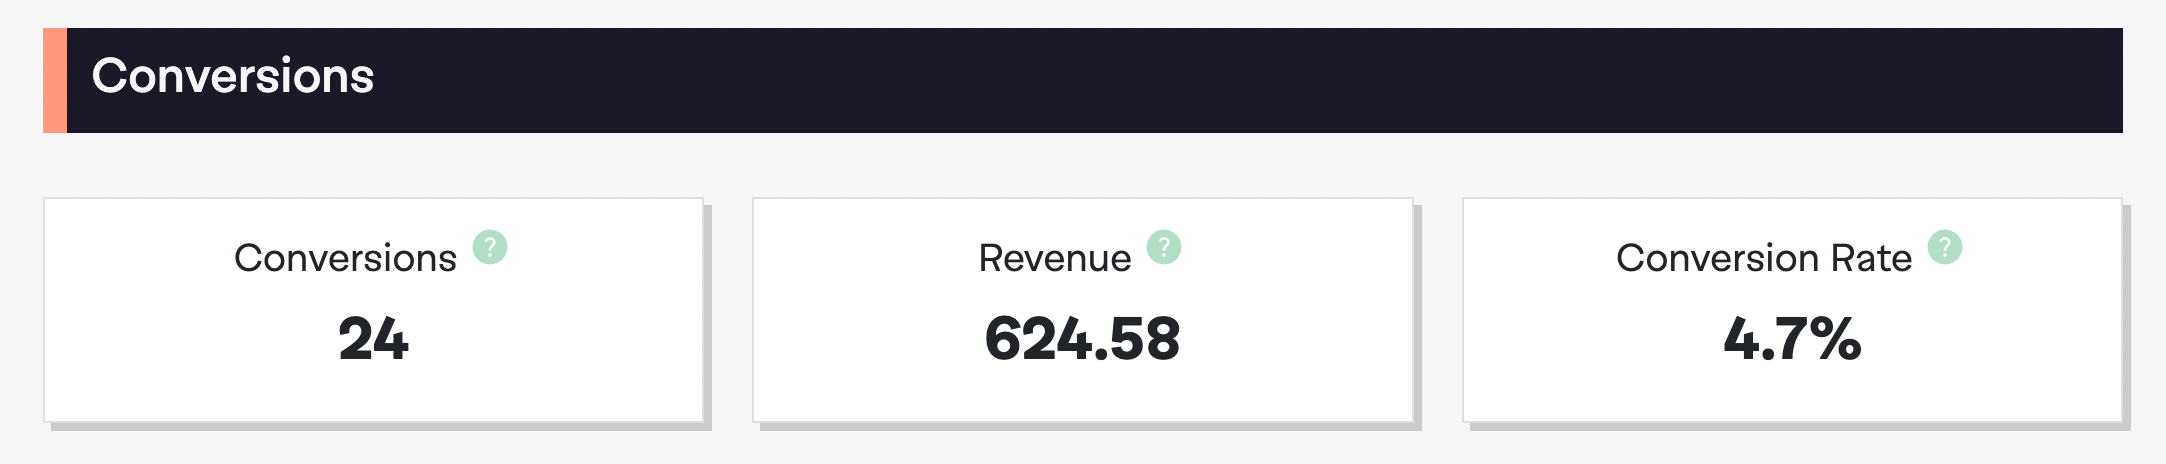
Conversions
Note: In order to see values here, you must first enable conversion tracking
Charts
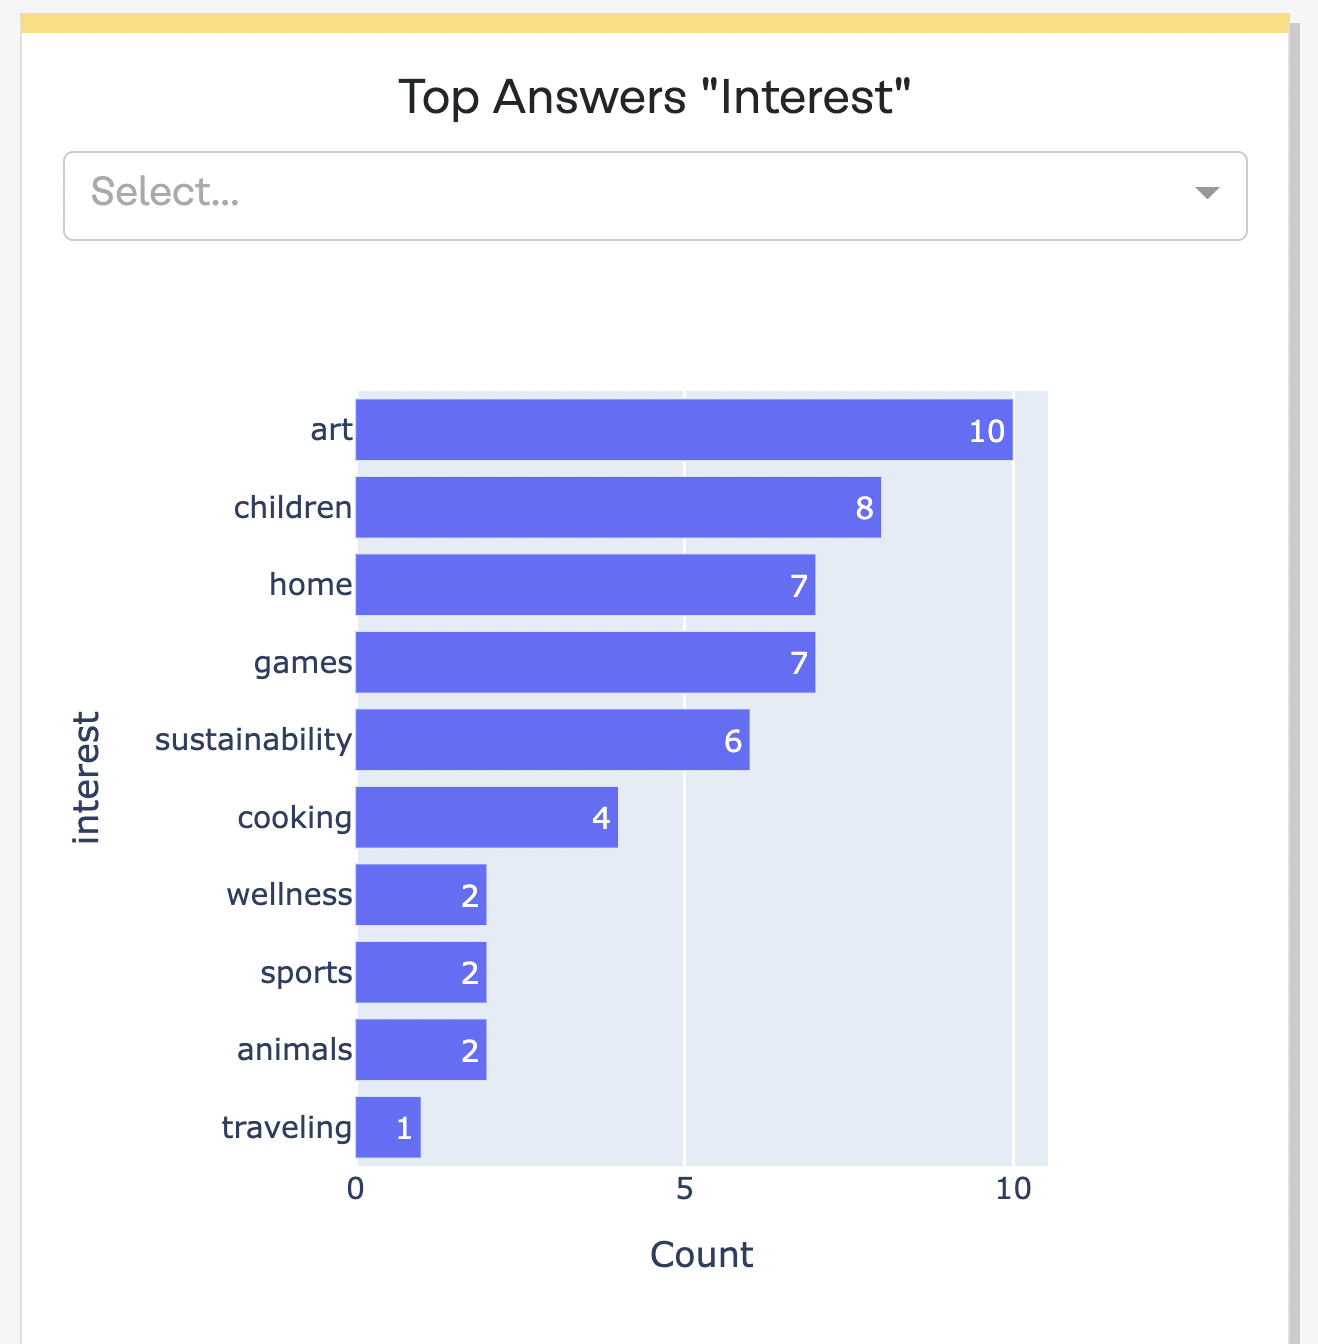
Top answers
For each question in your quiz you will see a bar chart that shows the top answers of the question. The length of the bars reflect how often an answer was chosen by users. These chart help you understand your users and see what topics are popular and which are less popular.
Tables
Top paths
The Top paths table shows the combination of answers that were chosen the most by your customers.
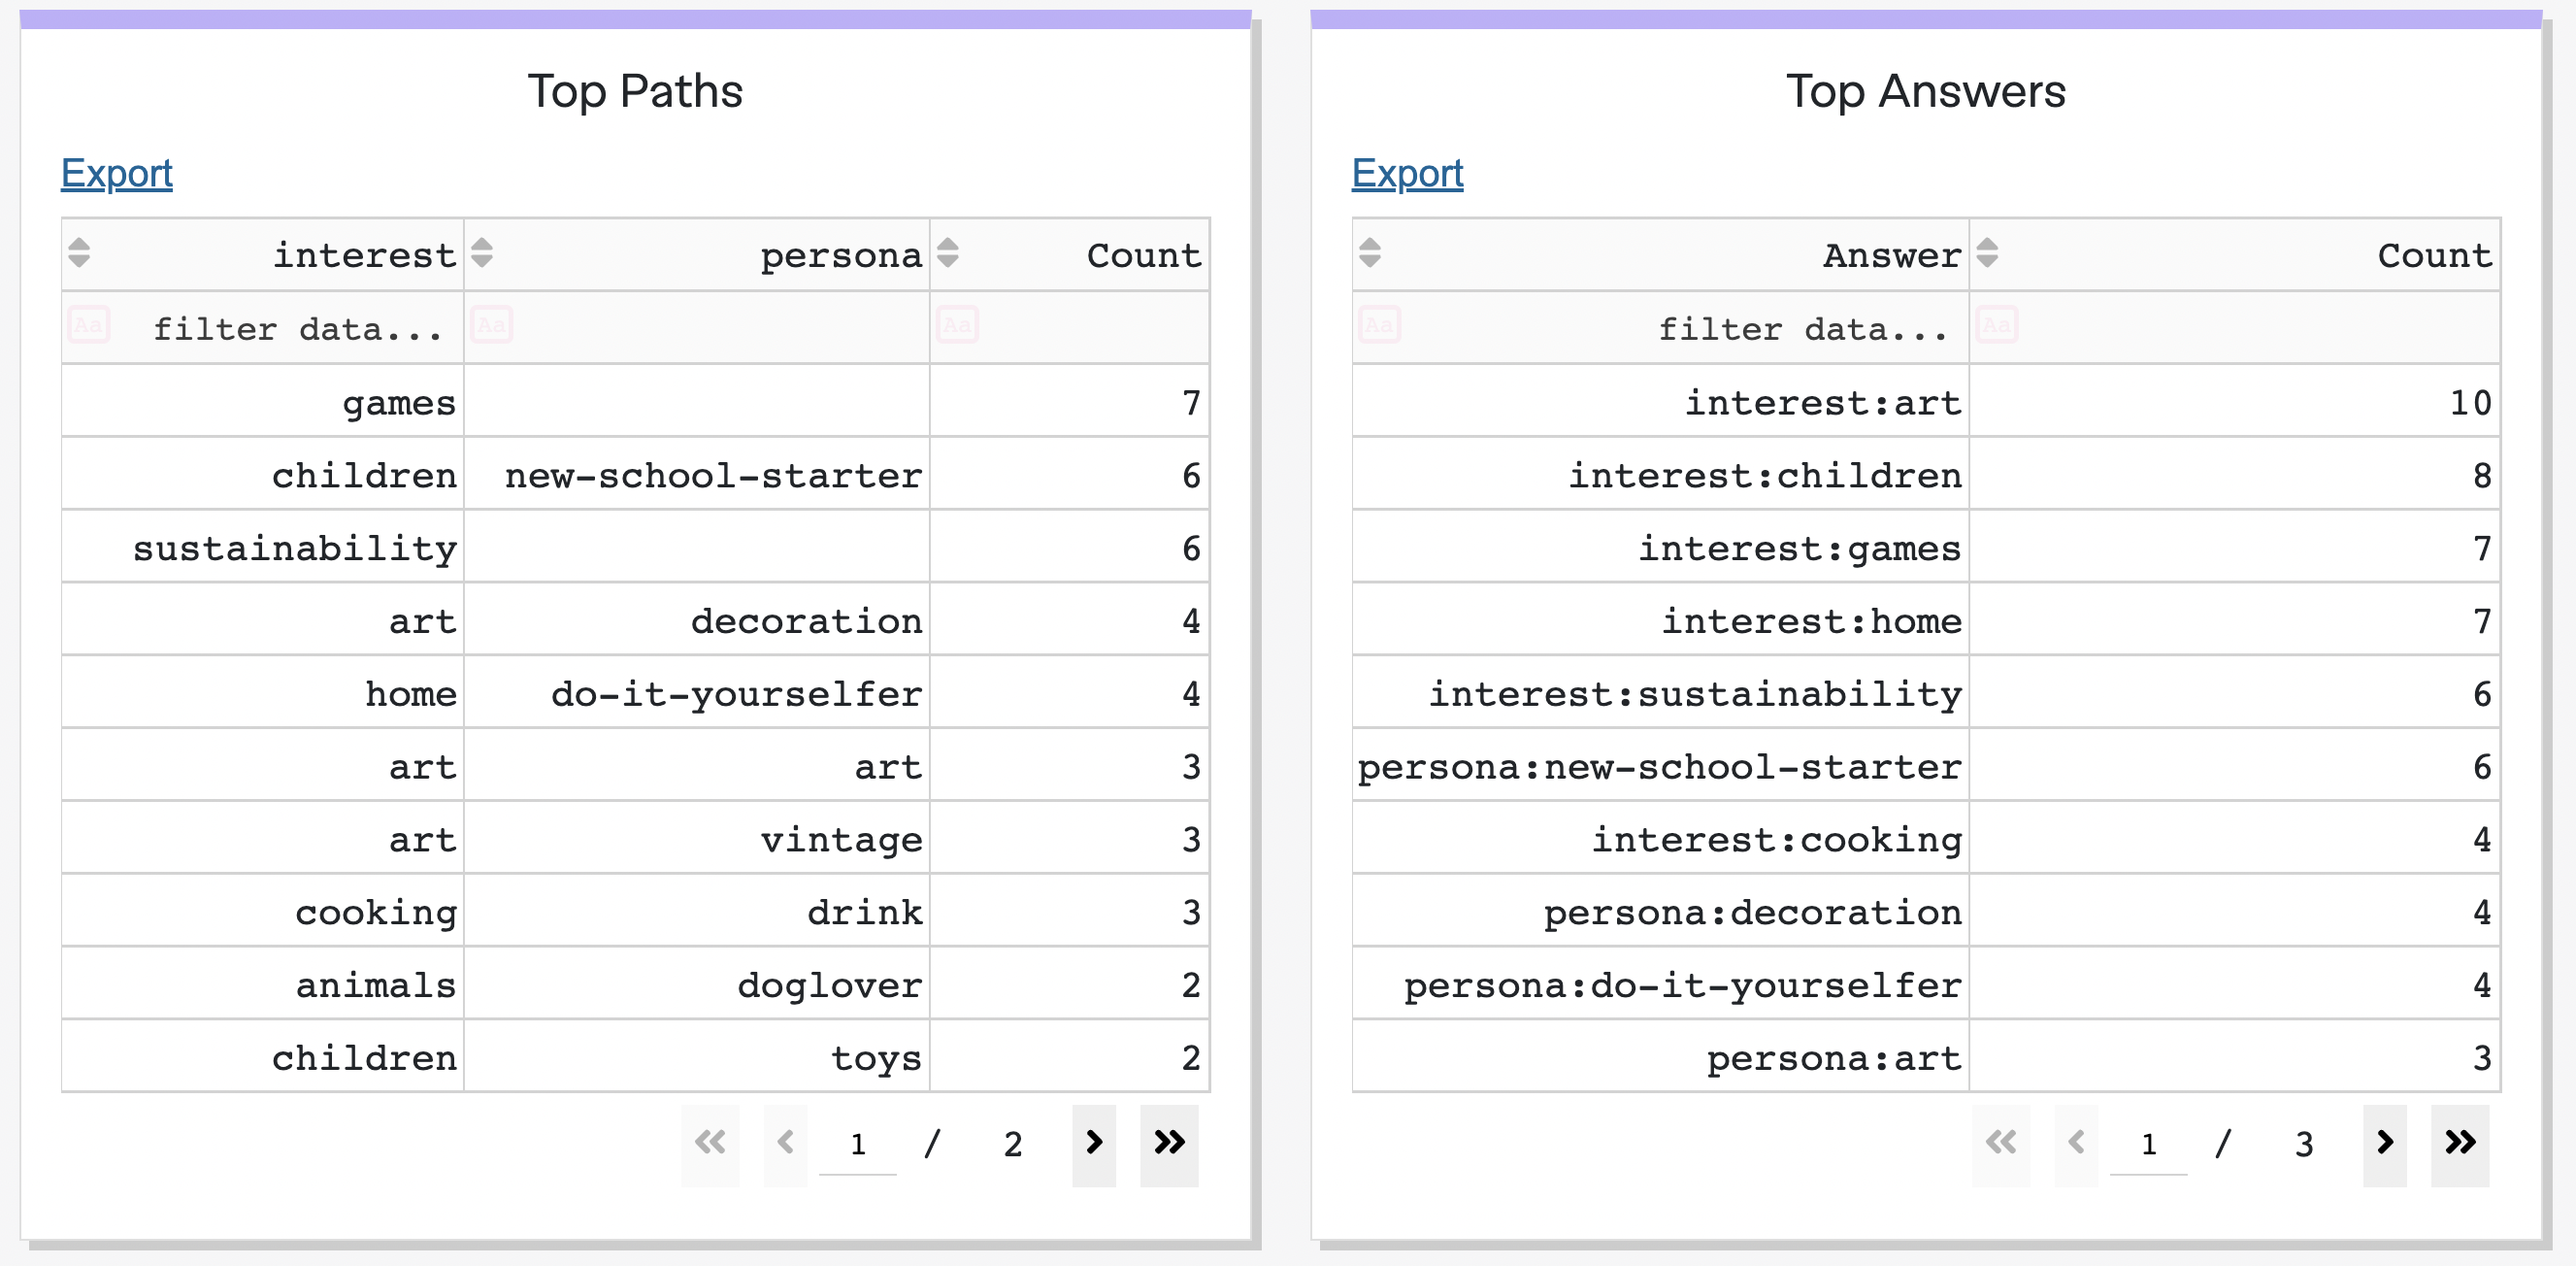
Top answers
The Top answers table shows the answers that were chosen the most by your customers.
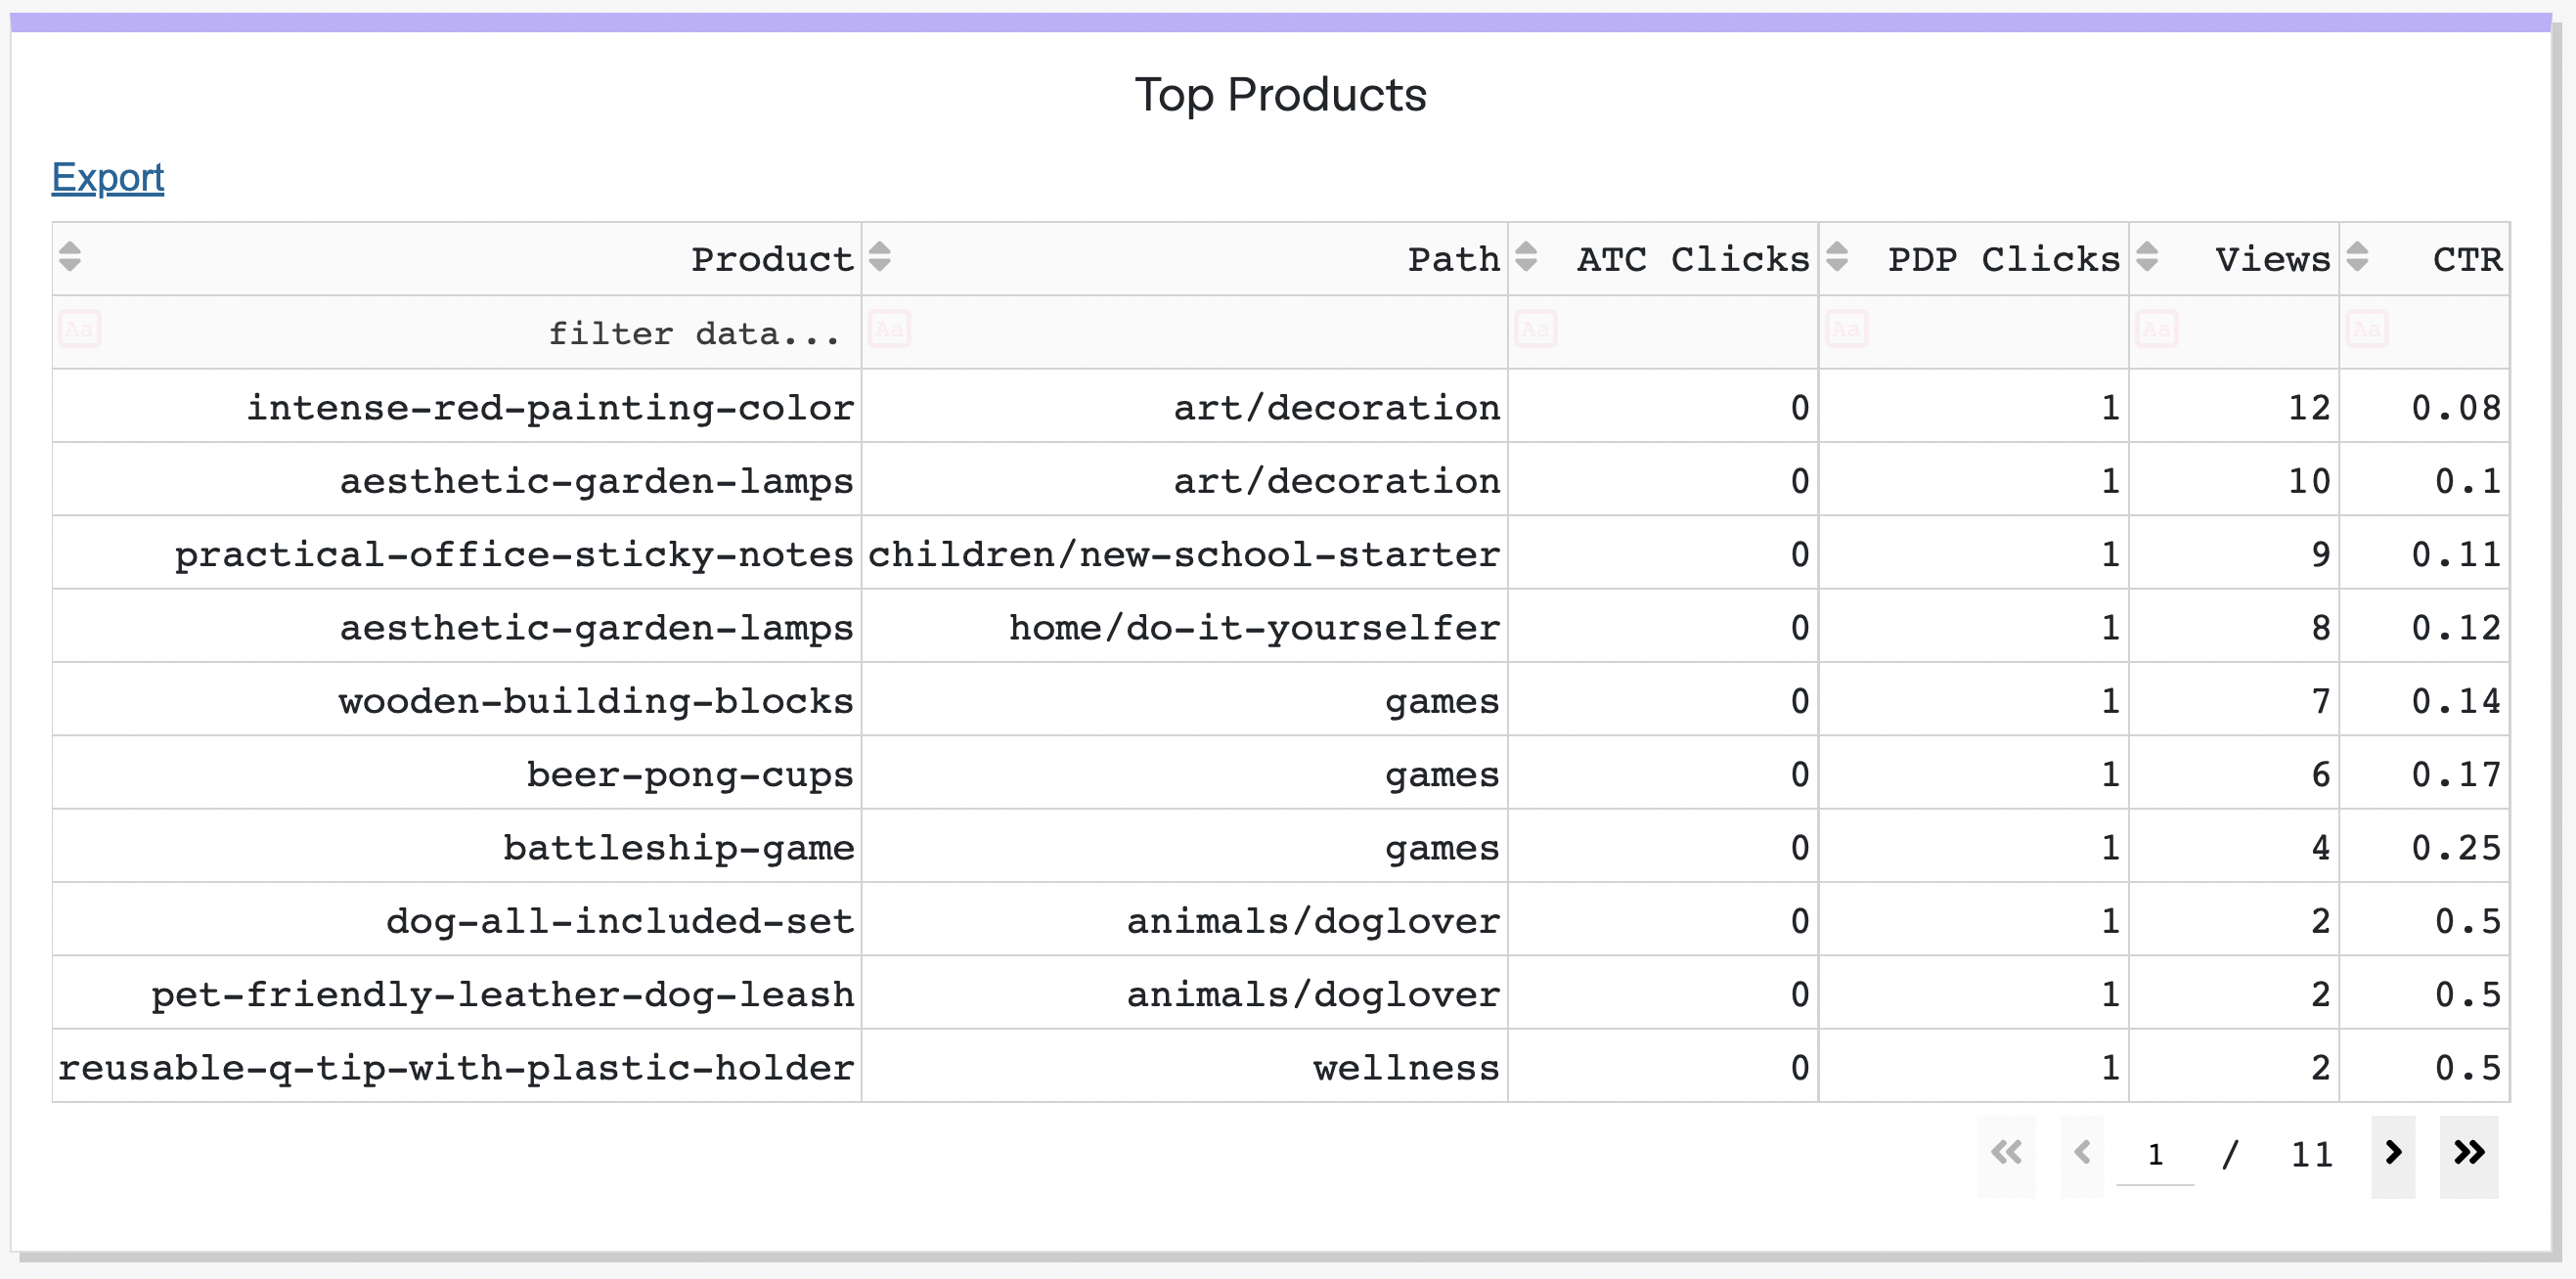
Top products
The Top products table shows the popularity of products in respect to the answers user chose. Here's a rundown of the columns in the table:
- Product: The product that was viewed by users
- Path: The combination of answers in the quiz that led to the product
- ATC Clicks: How often the product was added to cart directly from Product Finder
- PDP Clicks: How often the product detail page was viewed directly from Product Finder
- Views: How often the product was seen in the Product Finder
- CTR: The click-through-rate, i.e. the ratio of clicks per view